Get accurate f0 tracks using a method that combines automatic vocal pulse marking by Praat, manual correction by yourself, and a trimming algorithm that removes spikes and sharp edges (cf. Appendix 1 in Xu 1999)
Label intervals and/or points for each sound (.wav) file
Exhaustively process all the wav files in a folder
Get time-normalized f0 (for labeled intervals only) (cf. Xu 1997) and intensity. Useful if you want to plot mean f0 or intensity curves averaged across multiple repetitions of the same word or sentence
Get time-normalized f0 and intensity with original time preserved (cf. Xu & Xu, 2005). Useful if you want to plot mean f0 or intensity curves with averaged original time for each interval
Get rectified, trimmed f0 as PitchTier objects which can replace the pitch tier in Manipulation objects
Get sampled f0 (for labeled intervals only) -- f0 at fixed time intervals as determined by F0_sample_rate (number of points per second)
Get continuous f0 velocity (= first derivative of f0) curve (for labeled intervals only) -- at fixed time intervals as determined by F0_sample_rate
Get maxf0, minf0, f0range(st), meanf0, mean intensity, duration, max velocity, final velocity, final f0 and meanintensity from each labeled interval
Get results in ensembled files: normf0.txt, normIntensity, samplef0.txt, f0velocity.txt, maxf0.txt, minf0.txt, f0range.txt meanf0.txt, maxvelocity.txt, duration.txt, finalvelocity.txt, finalf0.txt and meanintensity.txt
Motivation and brief history
ProsodyPro is developed as a convenient tool for our own research. It allows us to systematicaly process large amount of speech data with high precision. It has maximally reduced the amount of human labor by automizing tasks that do not require human judgment, such as locating and opening sound files, taking measurements, and saving raw results in formats ready for further graphical and statistical analysis. On the other hand, it also allows human intervention of processes that are prone to error in automatic algorithms such as pitch detection and segmentation.
The f0 trimming time-normalization algorithms, which are part of the core of the script, were developed in my PhD research (Xu, 1993), which were then implemented in a C program working in conjunction with xwaves, which, like Praat, generates automatic vocal cycle markings that saves most of the manual labor in marking the cycle manually as done in my dissertation. The arrival of Praat, thanks to the brilliant invention of Paul Boersma and David Weenink, makes it possible to put these algorithms together in a single script that can run on all major computer platforms. It also solved the problem of having to write a different C program for each new experiment.
The first version of the script was made public in 2005. Since then it has been used in many research projects. Some are listed here.
Instructions
Put ProsodyPro.praat in the folder containing the sound files to be analyzed, and launch Praat;
Select Open Praat Script... from the top menu;
Locate ProsodyPro.praat in the dialogue window and select it;
When the script window opens in Praat, select Run from the Run menu (or type the key shortcut command-r or control-r);
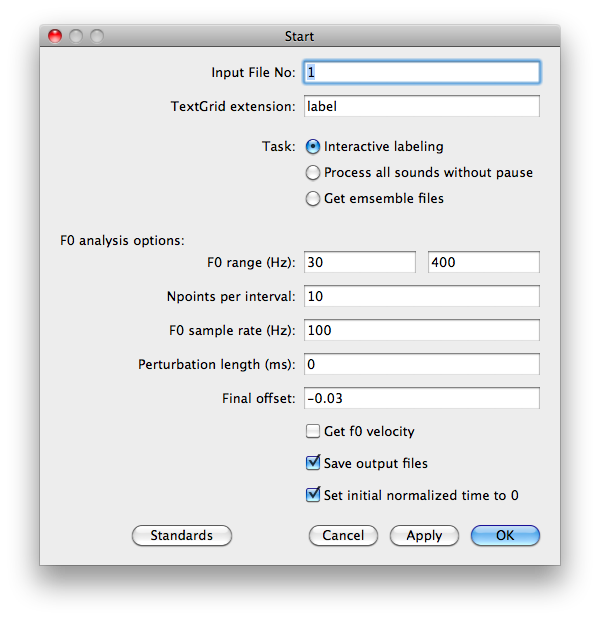
In the startup window, check or uncheck the boxes according to your need, and set appropriate values in the text fields or simply use the default values. Select the task by checking the appropriate radio button.
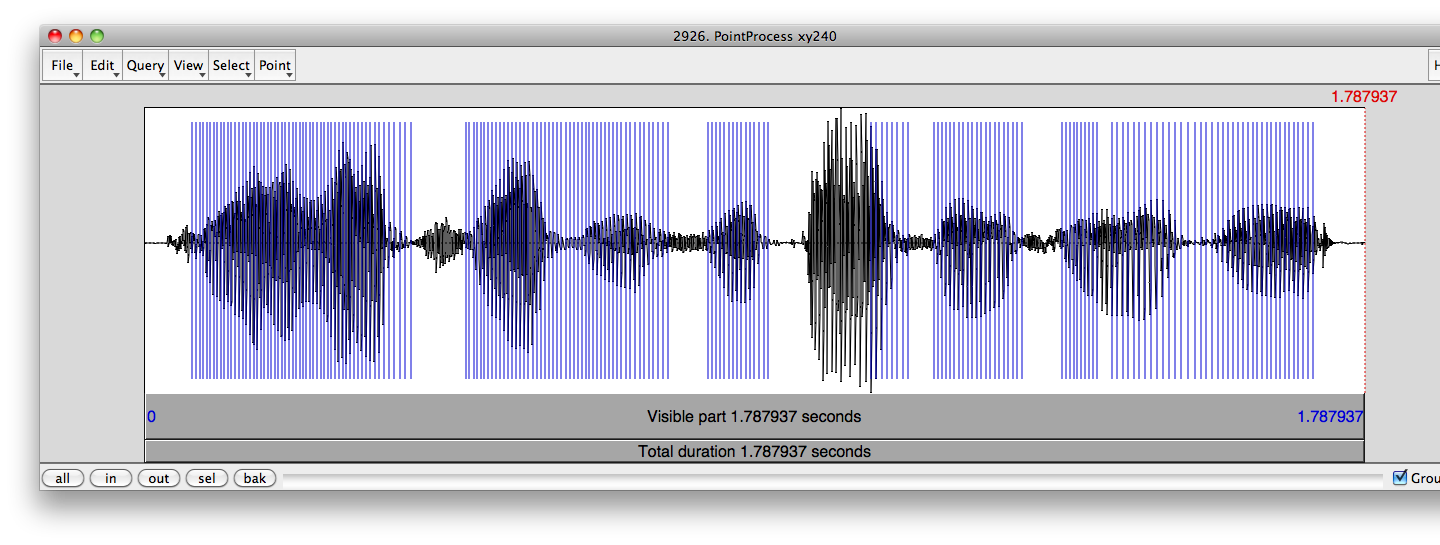
Click OK and three windows will appear. The first window (PointProcess) displays the waveform together with vocal cycle marks (vertical lines) generated by Praat. This is where you can manually add the missing marks and delete the redundant ones. You need to do this only for the named intervals, as explained next.
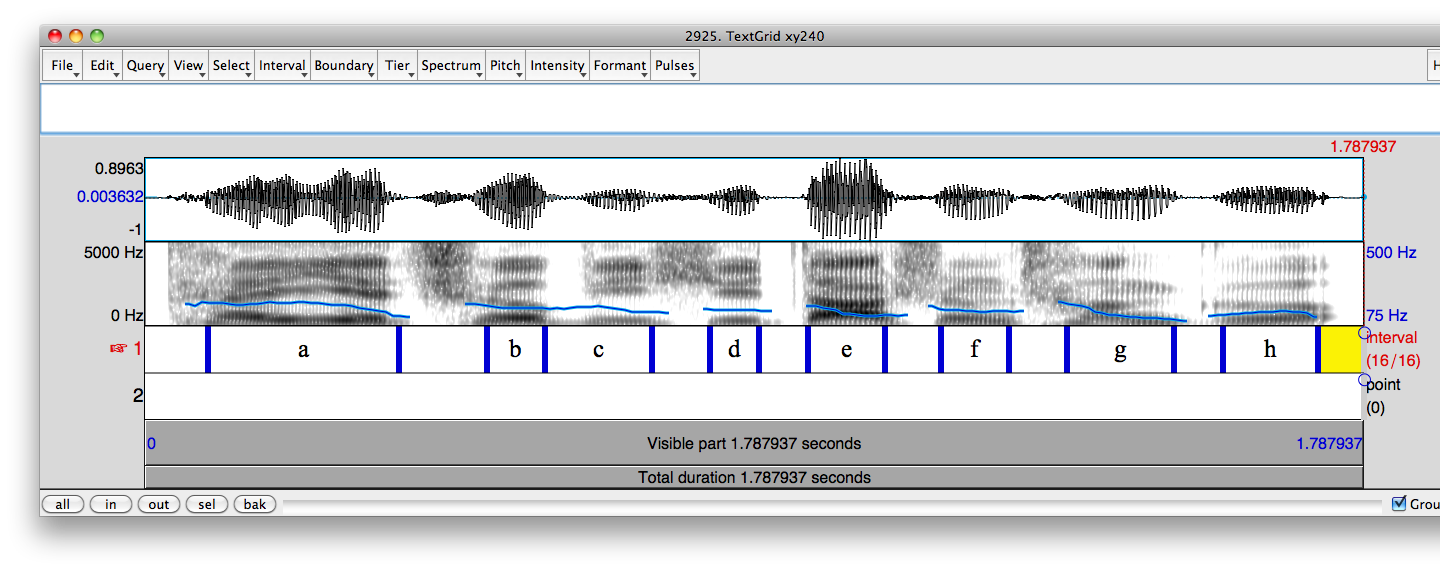
The second window (TextGrid) displays the waveform and spectrogram of the current sound together with optional pitch track and formant tracks in the spectrogram panel, and vocal pulse marks in the waveform panel. (These tracks and marks cannot be manually changed. So you can hide them to reduce processing time by using the corresponding menu.)
At the bottom of this window are two TextGrid tiers, where you can insert interval boundaries (Tier 1) and add comments (Tier 2). For any interval that you want to have results saved, a label in Tier 1 is required. The label can be as simple as a, b, c or 1, 2, 3.
The third window (Pause) allows you to control the progression of the analysis. You bring up the next found to be analyzed by changing the number (or leaving it as is) in the current_file box and pressing "Continue". The number indicates the order in the String object "list" in the Object window (a hardcopy is also saved in the current folder). The next sound will be 1 + current_file (So, type 0 to open sound 1).
To end the progression of the current analysis session, press "Finish" in the Pause window, and the last sound analyzed will be shown in the Praat Info window. You can use that number as a starting point in you next analysis session.
Output
Each time you press "Continue" in the Pause window, various analysis results are saved for the current sound as text files:
X.rawf0 -- raw f0 with real time computed directly from the pulse markings
X.f0 -- smoothed f0 with the trimming algorithm (Xu, 1999)
X.samplef0 -- f0 values at fixed time intervals specified by "f0 sample rate"
X.timenormf0 -- time-normalized f0. The f0 in each interval is divided into the same number of points (default = 10).
X.timenormIntensity -- time-normalized intensity. The intensity in each interval is divided into the same number of points (default = 10).
X.actutimenormf0 -- time-normalized f0 with each interval divided into the same number of points (default = 10). But the time scale is the original, except that the onset time of interval 1 is set to 0, unless the "Set initial time to 0" box in the startup window is unchecked.
X.f0velocity -- velocity profile (instantaneous rates of F0 change) of f0 contour in semitone/s at fixed time intervals specified by "f0 sample rate"
X.means -- Containing the following values (in the order of the columns):
maxf0
minf0
excursion size
finalf0 -- Indicator of target height (taken at a point specified by "Final offset" in the startup window)
mean intensity
duration
max_velocity
final_velocity -- Indicator of target slope (taken also at a point earlier than the interval offset by time specified by "Final offset" in the startup window)
If you want to change certain analysis parameters after processing all the sound files, you can rerun the script, set the "Input File No" to 1 in the startup window and check the button "Process all sounds without pause" before pressing "OK". The script will then run by itself and cycle through all the sound files in the folder one by one.
After the analysis of all the individual sound files are done, you can gather the analysis results into a number of ensemble files by running the script again and checking the button "Get ensemble results" in the startup window. The following ensemble files will be saved:
means.txt
normf0.txt
normIntensity.txt
normactutime.txt
samplef0.txt
f0velocity.txt
maxf0.txt
minf0.txt
excursionsize.txt
meanf0.txt
duration.txt
maxvelocity.txt
finalf0.txt
finalvelocity.txt
meanintensity.txt
Note that you can generate the ensemble files only if you have analyzed at least one sound following the steps described earlier.
Examples
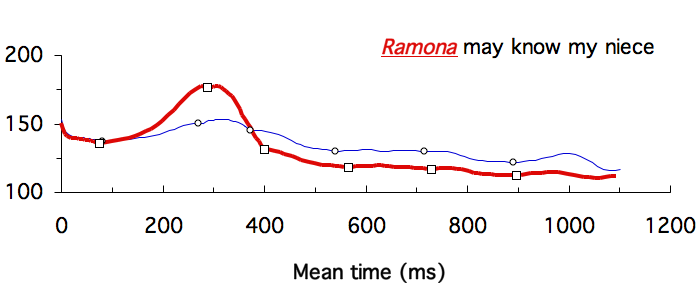
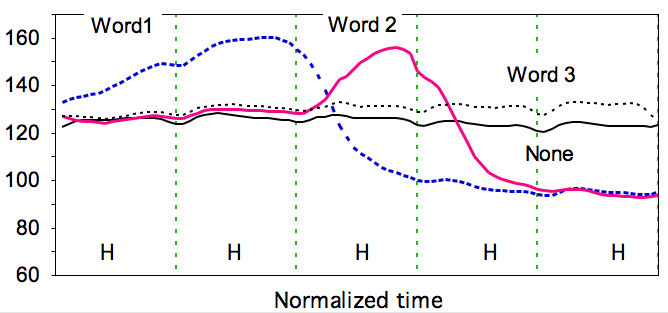
The following examples show how functional contrasts can be easily brought out by time-normalized f0 contours, whether plotted on normalized time or mean time.
_ _
_ _ _ _ _ _ _ _ _ _
Data from Xu (1999)
_ _ _ _ _ _ _ _ _ _ _ _ _ _ _ _ _ _ _ Data from Xu & Xu (2005)
Need more help?
Detailed instructions can be also found at the beginning of the script.
For more information, take a look at FAQ, and if you are still stuck, please write me (yi.xu at ucl.ac.uk).
Bug reports, suggestions on improvement and new features are also welcome.
How to cite
Xu, Y. (2005-2010). ProsodyPro.praat. Available from: http://crdo.fr/crdo000723
Arnhold, A., Vainio, M., Suni, A. and Jarvikivi, J. (2010). Intonation of Finnish Verbs. In Proceedings of Interspeech 2010.
Berry, J. (to appear). Tone reduction in Mandarin Chinese. Journal of Phonetics.
Chen, S.-w. and Tsay, J. (2010). Phonetic realization of suffix vs. non-suffix morphemes in Taiwanese. In Proceedings of Speech Prosody 2010, Chicago.
Greif, M. (2010). Contrastive Focus in Mandarin Chinese. In Proceedings of Speech Prosody 2010, Chicago.
Hsieh, F.-f. and Kenstowicz, M. J. (2008). Phonetic knowledge in tonal adaptation: Mandarin and English loanwords in Lhasa Tibetan. Journal of East Asian Linguistics 17: 279-297.
Ito, C. and Kenstowicz, M. (2009). Mandarin Loanwords in Yanbian Korean II: Tones. Language Research 45: 85-109.
Kenstowicz, M. (2008). On the Origin of Tonal Classes in Kinande Noun Stems. Studies in African Linguistics 37: 115-151.
Lee, Y.-c. and Nambu, S. (2010). Focus-sensitive operator or focus inducer: always and only. In Proceedings of Interspeech 2010.
Liu, F. (2010). Single vs. double focus in English statements and yes/no questions. In Proceedings of Speech Prosody 2010, Chicago.
王玲、尹巧云、王蓓、刘岩 (2010). 德昂语布雷方言中焦点的韵律编码方式 [Prosodic focus in Bulei dialect of Deang]. Proceedings of The 9th Phonetics Conference of China (PCC2010), Tianjin.
Wu, W. L. (2009). Sentence-final particles in Hong Kong Cantonese: Are they tonal or intonational? In Proceedings of Interspeech 2009.
尹巧云、王玲、杨文华、王蓓、刘岩 (2010). 德昂语中焦点和疑问语气在语调上的共同编码 [Parallel encoding of focus and interrogative modality in Deang]. Proceedings of The 9th Phonetics Conference of China (PCC2010).
Zhao, Y. and Jurafsky, D. (2009). The effect of lexical frequency and Lombard reflex on tone hyperarticulation. Journal of Phonetics 37(2): 231-247.
 _ _
_ _