The current chapter describes how to use the Graphical User Interface.
Under Windows, once the SPPAS package is opened in the File Explorer, double-click on the sppas.bat file.
Under MacOS or Linux, once the SPPAS package is opened in the Finder/File Explorer, double-click on the sppas.command file. The program will first check the version of wxpython and eventually ask to update.
Then, two windows will open automatically.
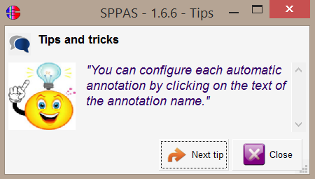
Above, a window with a tips aims at displaying messages to help users to discover SPPAS capabilities.
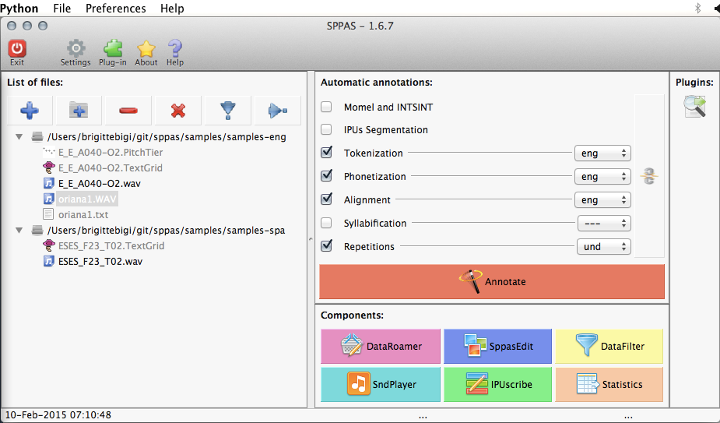
Below, the main frame: to perform automatic annotations, get statistics, filter data, view wav/annotated data, etc.
This frame picks up randomly and prints a message to help users. Click on the button Next Tip to read another message, or click on the Close button to close the frame.
The Settings frame also allows to show/hide the Tips frame at start-up.
If you want to suggest new tips (to help the other users), send them by e-mail to the author at brigitte.bigi@gmail.com. They will be included in the next version.
The main frame is made of a menu, a toolbar and the main content. All of them are described in the next sub-sections.
It allows to access to all functions of the GUI, and to manage it.
The "File" menu can be used to manage files (add, remove, ...) and to exit the program.
In the "Preferences" menu, check boxes allow to show/hide the toolbar and the status bar, and to fix settings (see below for details).
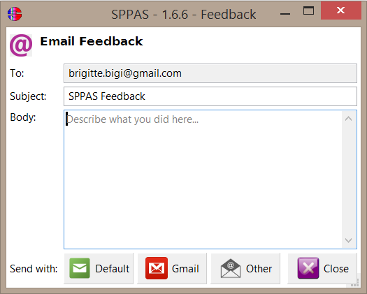
The "Help" menu includes an item to open the SPPAS website in a web browser, to access inline documentation, to declare a bug and to send feedback to the author. In the latter case, replace the text "Describe what you did here..." by your own comment, question or suggestion and choose how to send the e-mail: with your own default mailer, with gmail (opened in your web browser) or by another e-mail client. Then, close the frame by clicking on the "Close" button.
The toolbar includes 5 buttons:
The look of the toolbar can change depending of the Theme of the icons.

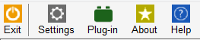
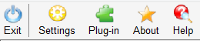
The Exit button closes all SPPAS frames properly. Please, do not kill SPPAS by clicking on the arrow of the windows manager! Use this Exit button to close SPPAS.
To fix new settings, click on the Settings icon, then choose your preferred options:
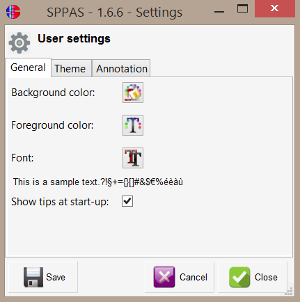
The Settings can be saved in a file to be used each time SPPAS is executed. To close the frame, click on:
The Plug-in button allows to install a new plugin.
The About button opens a new frame which gives the main information about SPPAS: authors, license, web site URL, etc.
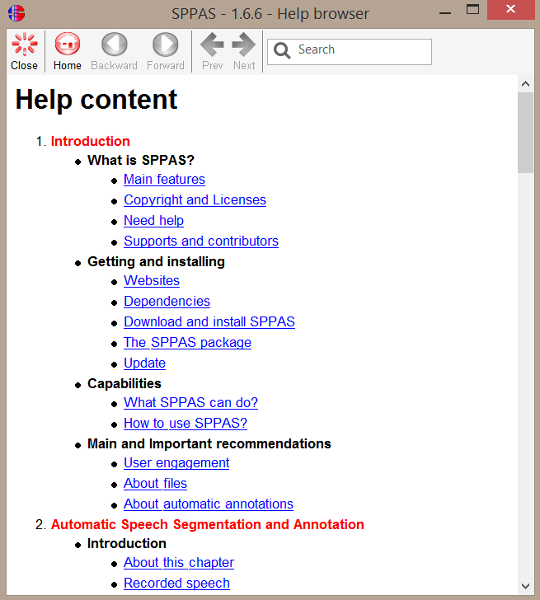
The Help button opens the documentation and allows to browse in the chapters and sections.
The content of the main frame is made of 4 main panels:
The File List Panel (FLP) consists of:
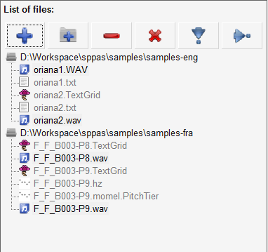
The list contains Directories and Files the user added, but only files that SPPAS can deal with (depending on the file extension).
To select:
Like in any other file explorer, while clicking and pressing the "CTRL" key ("COMMAND" on MacOS) on the keyboard, you can select multiple files and/or directories. Idem with the "SHIFT" key.
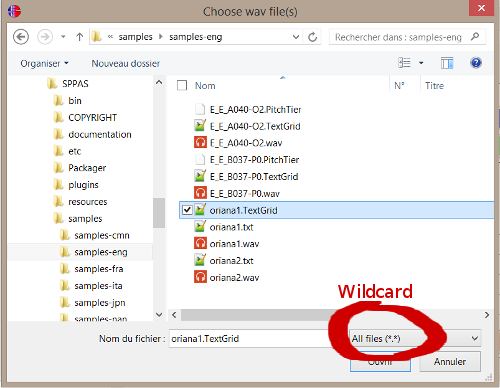
A single-click on the Add File button opens a frame that allows to select the files to get. By default, only "wav" files are proposed. If you select a wav file(s), all files with the same name will be automatically added into the file explorer. It is possible to change the wildcard of this frame and to select each file to add. In both cases, only files with an appropriate extension will be added in the file explorer.
Remark: The files are added in the list, but they are not opened.
A single-click on the Add Dir button opens a frame that allows to select the directory to get. Each wav file, and all related files (i.e. with the same name and with an appropriate extension) will be added into the file explorer.
A single-click on the Remove button removes the selected files/directories.
Notice that files are not deleted from the disk, they are just removed of the FLP.
A single-click on the Delete button deletes definitively the selected files/directories of your computer, and remove them of the FLP. Notice that there is no way to get them back!
A dialogue frame will open, and you'll have to confirm or cancel the definitive file(s) deletion.
A single-click on the Copy button allows to copy the selected file(s), change their name and/or change the location (eventually, change the file extension).
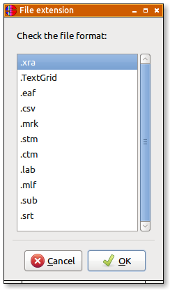
Export annotated files in an other format (csv, txt, ...):
After the export, a new frame will open to report if file(s) were exported successfully or not.
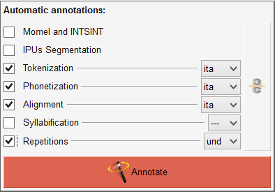
The Automatic Annotations Panel (AAP) consists of a list of buttons to check (the left column), the annotation name (middle) and buttons to fix the language of each annotation (at right).
Remark: to understand what each annotation is for, please refer to the chapter "Automatic Speech Segmentation and Annotation" of this document.
Select each annotation to perform. Each annotation can be configured by clicking on the annotation name.
Select the language for all annotations, or for each one independently by clicking on the "chains" button.
Click on the Annotate button... and wait! Please, wait! Particularly for Tokenization or Phonetization: loading resources (lexicons or dictionaries) is very long. Sometimes, the progress bar does not really "progress"...it depends on the system. So, just wait!
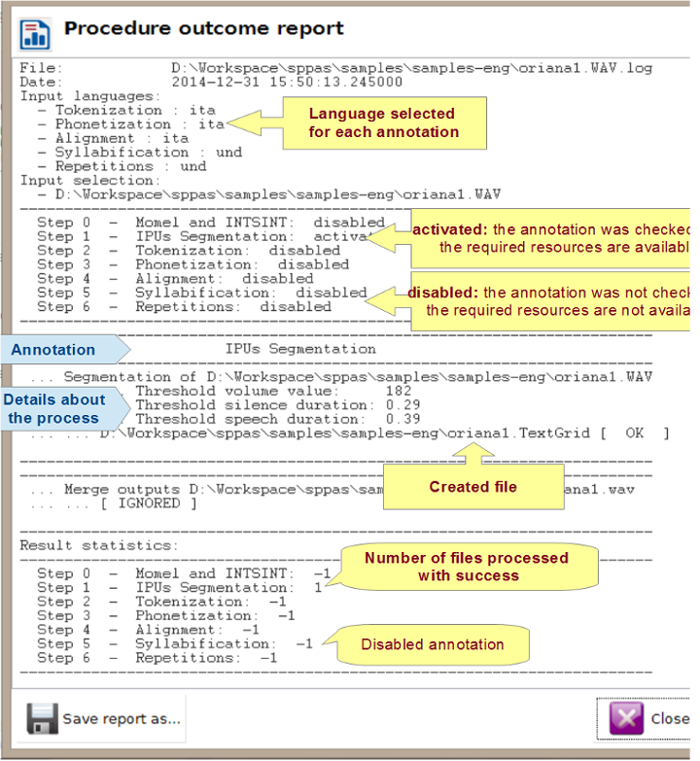
It is important to read the Procedure Outcome report to check that everything happened normally during the automatic process.
It is very important to read conscientiously this report: it mentions exactly what happened during the automatic annotation process. This text can be saved: it is recommended to be kept it with the related data because it contains information that are interesting to know for anyone using the annotations!
The text first indicates the version of SPPAS that was used. This information is very important, mainly because annotations in SPPAS and their related resources are regularly improved and then, the result of the automatic process can change from one version to the other one.
Secondly, the text mentions information related to the given input:
In the following, each automatic annotation is described in details, for each annotated file. Three levels of information must draw your attention:
Finally, the "Result statistics" section mentions the number of files that was annotated for each step, or -1 if the annotation was disabled.
The components are useful for the analysis of annotated files: display the automatic alignments with the audio signal, estimates statistics on the annotations, filter the annotated data to get only the annotations you are interested in, etc.
To execute a specific component, select file(s) in the file explorer, then click on the button of a component. It will open the component frame, and add the selected file(s) in the file manager of the component. Refer to the documentation of each component to know how to use it.
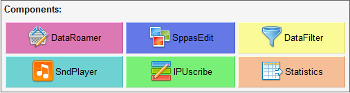
Six components are available:
DataRoamer allows to explore the annotated files: cut/copy/paste/rename/duplicate tiers, move a tier from one file to another one, etc.SndPlayer allows to play your speech files.IPUscribe is useful to perform manual orthographic transcription.SppasEdit displays speech files and annotated files, and is very useful to take a screenshot! Easy way to zoom/scroll, change colours, choose the tiers to display, etc;DataFilter allows to select annotations: fix a set of filters to create new tiers with only the annotations you are interested in!Statistics estimates the number of occurrences, the duration, etc. of the annotations, and allows to save in CSV (for Excel, OpenOffice, R, MatLab,...).All of the components share the same style:
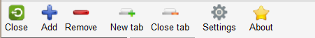
Seven buttons are available:
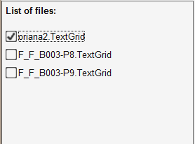
The most important information to know is that when files are added in the list, they are not opened: only checked files are loaded.
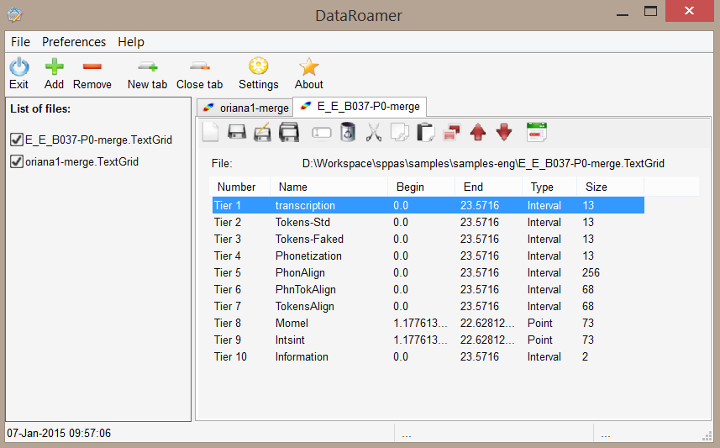
DataRoamer displays detailed information about annotated files and allows to manage the tiers: cut/copy/paste/rename/duplicate tiers, move a tier from one file to another one, etc.
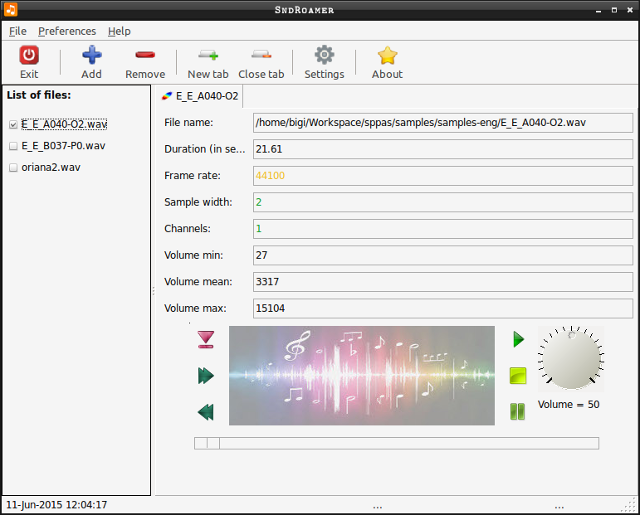
SndRoamer allows to play your speech files and to get information.
IPUscribe is useful to perform manual orthographic transcription.
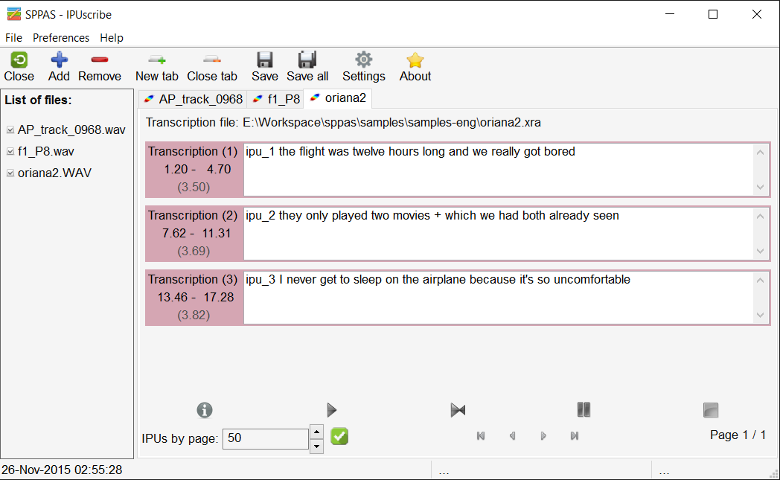
To transcribe an IPU, click on the IPU box, play sound and write the corresponding text: refer to the transcription convention of this document. To manage sound, use green buttons just at the bottom of the IPUs list (from left to right):
The following keyboard shortcuts can also be used:
This component is still under-development, some "troubles/crashes" can occur while using it... but the data will never been corrupted!!
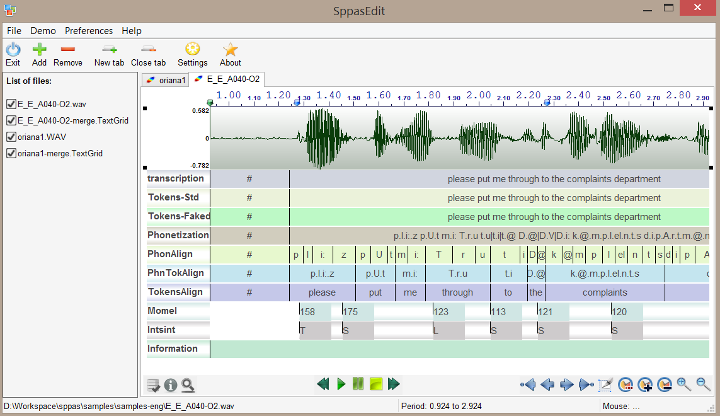
DataViewer displays speech files and annotated files, and is very useful to take a nice screenshot! Most of the screenshots of annotated data of this document were taken with it...
Try the Demo of this component: easy way to zoom/scroll, change colours, choose the tiers to display, etc!
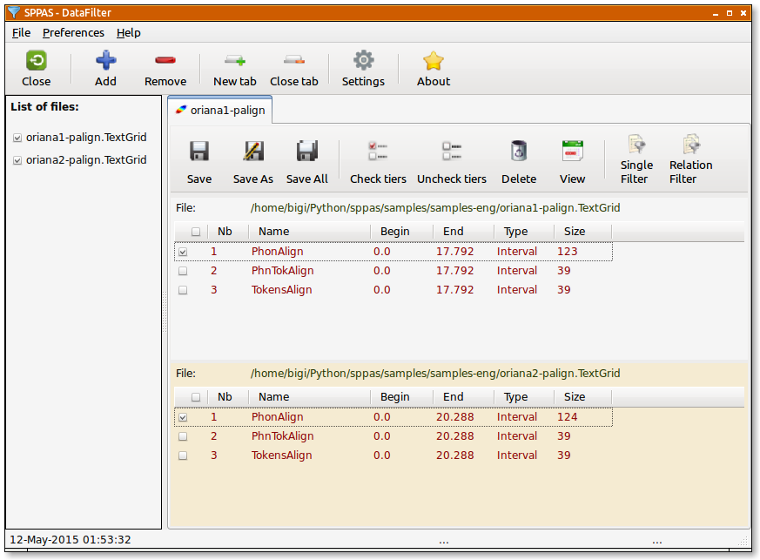
DataFilter allows to select annotations: fix a set of filters to create new tiers with only the annotations you are interested in! This system is based on the creation of 2 different types of filters:
These later are applied on tiers of many kind of input files (TextGrid, eaf, trs, csv...). The filtering process results in a new tier, that can re-filtered and so on.
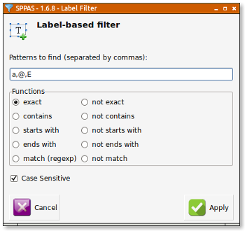
Pattern selection is an important part to extract data of a corpus and is obviously and important part of any filtering system. Thus, if the label of an annotation is a string, the following filters are proposed in DataFilter:
All these matches can be reversed to represent respectively: does not exactly match, does not contain, does not start with or does not end with. Moreover, this pattern matching can be case sensitive or not.
For complex search, a selection based on regular expressions is available for advanced users.
A multiple pattern selection can be expressed in both ways:
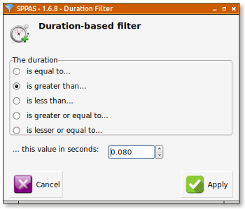
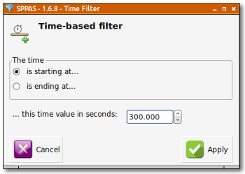
Another important feature for a filtering system is the possibility to retrieve annotated data of a certain duration, and in a certain range of time in the timeline.
Search can also starts and/or ends at specific time values in a tier.
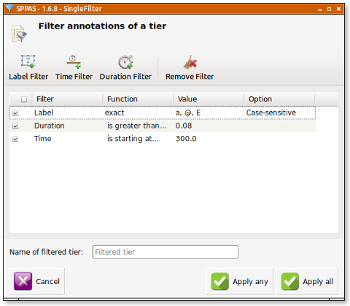
All the given filters are then summarized in the "SingleFilter" frame. To complete the filtering process, it must be clicked on one of the apply buttons and the new resulting tiers are added in the annotation file(s).
In the given example:
Regarding the searching problem, linguists are typically interested in locating patterns on specific tiers, with the possibility to relate different annotations a tier from another. The proposed system offers a powerful way to request/extract data, with the help of Allen's interval algebra.
In 1983 James F. Allen published a paper in which he proposed 13 basic relations between time intervals that are distinct, exhaustive, and qualitative:
These relations and the operations on them form Allen's interval algebra. These relations were extended to Interval-Tiers as Point-Tiers to be used to find/select/filter annotations of any kind of time-aligned tiers.
For the sake of simplicity, only the 13 relations of the Allen's algebra are available in the GUI. But actually, we implemented the 25 relations proposed Pujari and al. (1999) in the INDU model. This model is fixing constraints on INtervals (with Allen's relations) and on DUration (duration are equals, one is less/greater than the other). Such relations are available while requesting with Python.
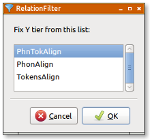
At a first stage, the user must select the tiers to be filtered and click on "RelationFilter". The second stage is to select the tier that will be used for time-relations.
The next step consists in checking the Allen's relations that will be applied. The last stage is to fix the name of the resulting tier. The above screenshots illustrates how to select the first phoneme of each token, except for tokens that are containing only one phoneme (in this later case, the "equal" relation should be checked).
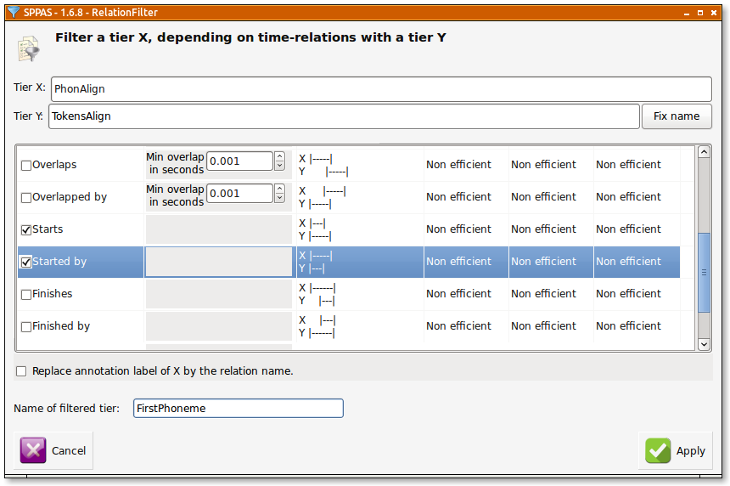
To complete the filtering process, it must be clicked on the "Apply" button and the new resulting tiers are added in the annotation file(s).
Statistics allows to get descriptives statistics about a set of selected tiers. It also allows to estimate a user agreement rate (Kappa as a first stage) and includes TGA (Time Group Analyzer), originaly available at http://wwwhomes.uni-bielefeld.de/gibbon/TGA/, a tool developped by Dafydd Gibbon, emeritus professor of English and General Linguistics at Bielefeld University.
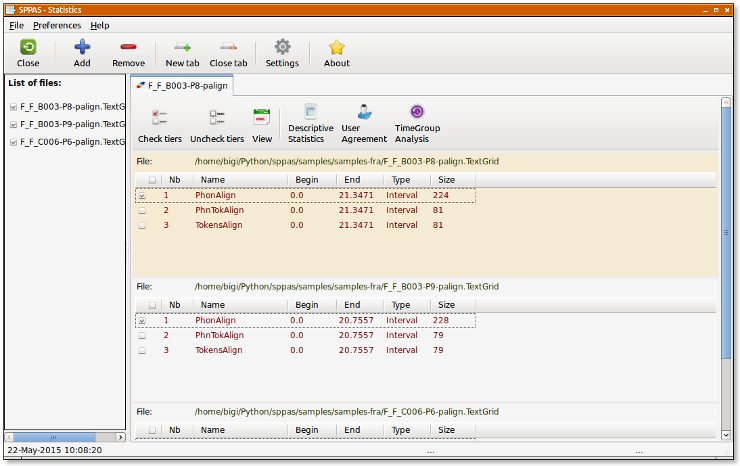
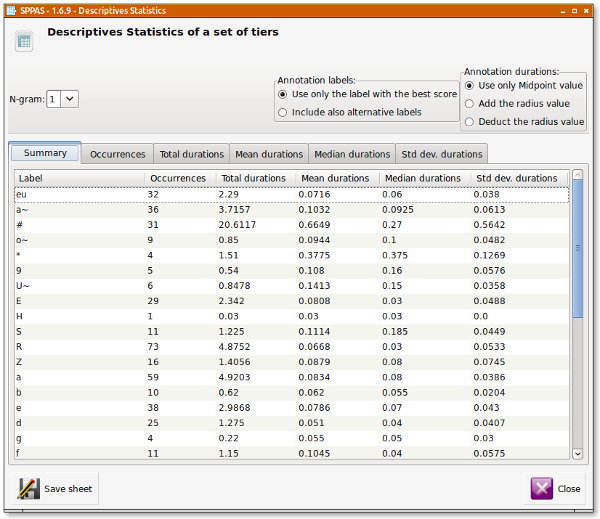
It allows to estimate the number of occurrences, the duration, etc. of the annotations of a set of selected tiers, and allows to save in CSV (for Excel, OpenOffice, R, MatLab,...). It offers a serie of sheets organized in a notebook. The first tab is displaying a summary of descriptive statistics of the set of given tiers. The other tabs are indicating one of the statistics over the given tiers. The followings are estimated:
All of them can be estimated on a single annotation label or on a serie of them. The lengh of this context can be optionally changed while fixing the "N-gram" value (available from 1 to 5), just above the sheets.
Each displayed sheet can be saved as a CSV file, which is a useful file format to be read by R, Excel, OpenOffice, LibreOffice, and so... To do so, display the sheet you want to save and click on the button "Save sheet", just below the sheets. If you plan to open this CSV file with Excel under Windows, it is recommended to change the encoding to UTF-16. For the other cases, UTF-8 is probably the most relevant.
The annotation durations are commonly estimated on the Midpoint value, without taking the radius into account; see (Bigi et al, 2012) for explanations about the Midpoint/Radius. Optionnally, the duration can either be estimated by taking the vagueness into account, then check "Add the radius value" button, or by ignoring the vagueness and estimating only on the central part of the annotation, then check "Deduct the radius value".
For those who are estimating statistics on XRA files, you can either estimate stats only on the best label (the label with the higher score) or on all labels, i.e. the best label and all its alternatives (if any).
SPPAS integrates the estimation of the Cohen's Kappa. It is currently limited to the evaluation of this user agreement between labels of 2 tiers with the same number of intervals.
Dafydd Gibbon (2013). TGA: a web tool for Time Group Analysis, Tools ans Resources for the Analysis of Speech Prosody, Aix-en-Provence, France, pp. 66-69.
The TGA is an online batch processing tool which provides a parametrised mapping from time-stamps in speech annotation files in various formats to a detailed analysis report with statistics and visualisations. TGA software calculates, inter alia, mean, median, rPVI, nPVI, slope and intercept functions within interpausal groups, provides visualisations of timing patterns, as well as correlations between these, and parses interpausal groups into hierarchies based on duration relations. Linear regression is selected mainly for the slope function, as a first approximation to examining acceleration and deceleration over large data sets.
The TGA online tool was designed to support phoneticians in basic statistical analysis of annotated speech data. In practice, the tool provides not only rapid analyses but also the ability to handle larger data sets than can be handled manually.
Katarzyna Klessa, Dafydd Gibbon (2014). Annotation Pro + TGA: automation of speech timing analysis, 9th International conference on Language Resources and Evaluation (LREC), Reykjavik (Iceland). pp. 1499-1505, ISBN: 978-2-9517408-8-4.
The integrated Annotation Pro + TGA tool incorporates some TGA features and is intended to support the development of more robust and versatile timing models for a greater variety of data.
The integration of TGA statistical and visualisation functions into Annotation Pro+TGA results in a powerful computational enhancement of the
existing AnnotationPro phonetic workbench, for supporting experimental analysis and modelling of speech timing.
So... What's the novelty...
TGA is partly implemented in SPPAS. The Statistics component of SPPAS allows to estimates TGA within the SPPAS framework. It results in the following advantages:
it estimates 2 linear regressions (the y-axis is the duration in both cases):
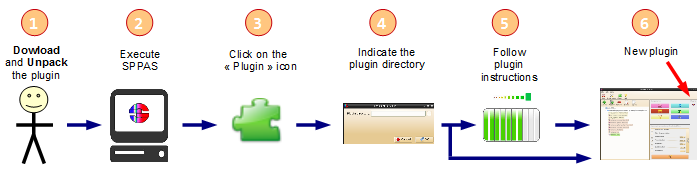
This panel includes the icons of plugins that were previously installed. To execute a plug-in, select file(s) in the File explorer, click on the icon of the plug-in and follow instructions of the plugged program.

To install a plugin, follow this workflow:
MarsaTag-Plugin is a plugin to use the French POS-tagger MarsaTag directly from SPPAS. Using this plugin offers two main advantages:
Notice that you must install MarsaTag first: http://sldr.org/sldr000841
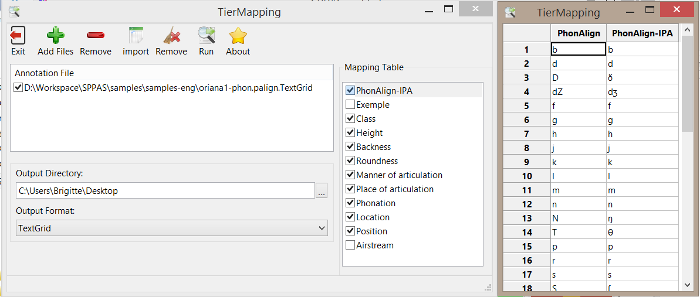
This plugin allows to create new tiers by mapping the labels of an existing tier, with new labels. Some mapping-tables are included in the plugin:
Furthermore, any user can easily create a mapping table. The only requirements are that all tables must be UTF-8 encoded in a CSV file, with columns separated by semi-columns. These tables can be imported/modified/saved with OpenOffice, LibreOffice, Excel, ... The most important is to not change its properties (UTF8, semi-columns) and location (inside the resources directory of the plug-in directory).
Brigitte Bigi © 2011-2015